

Data acquisition:
Own research
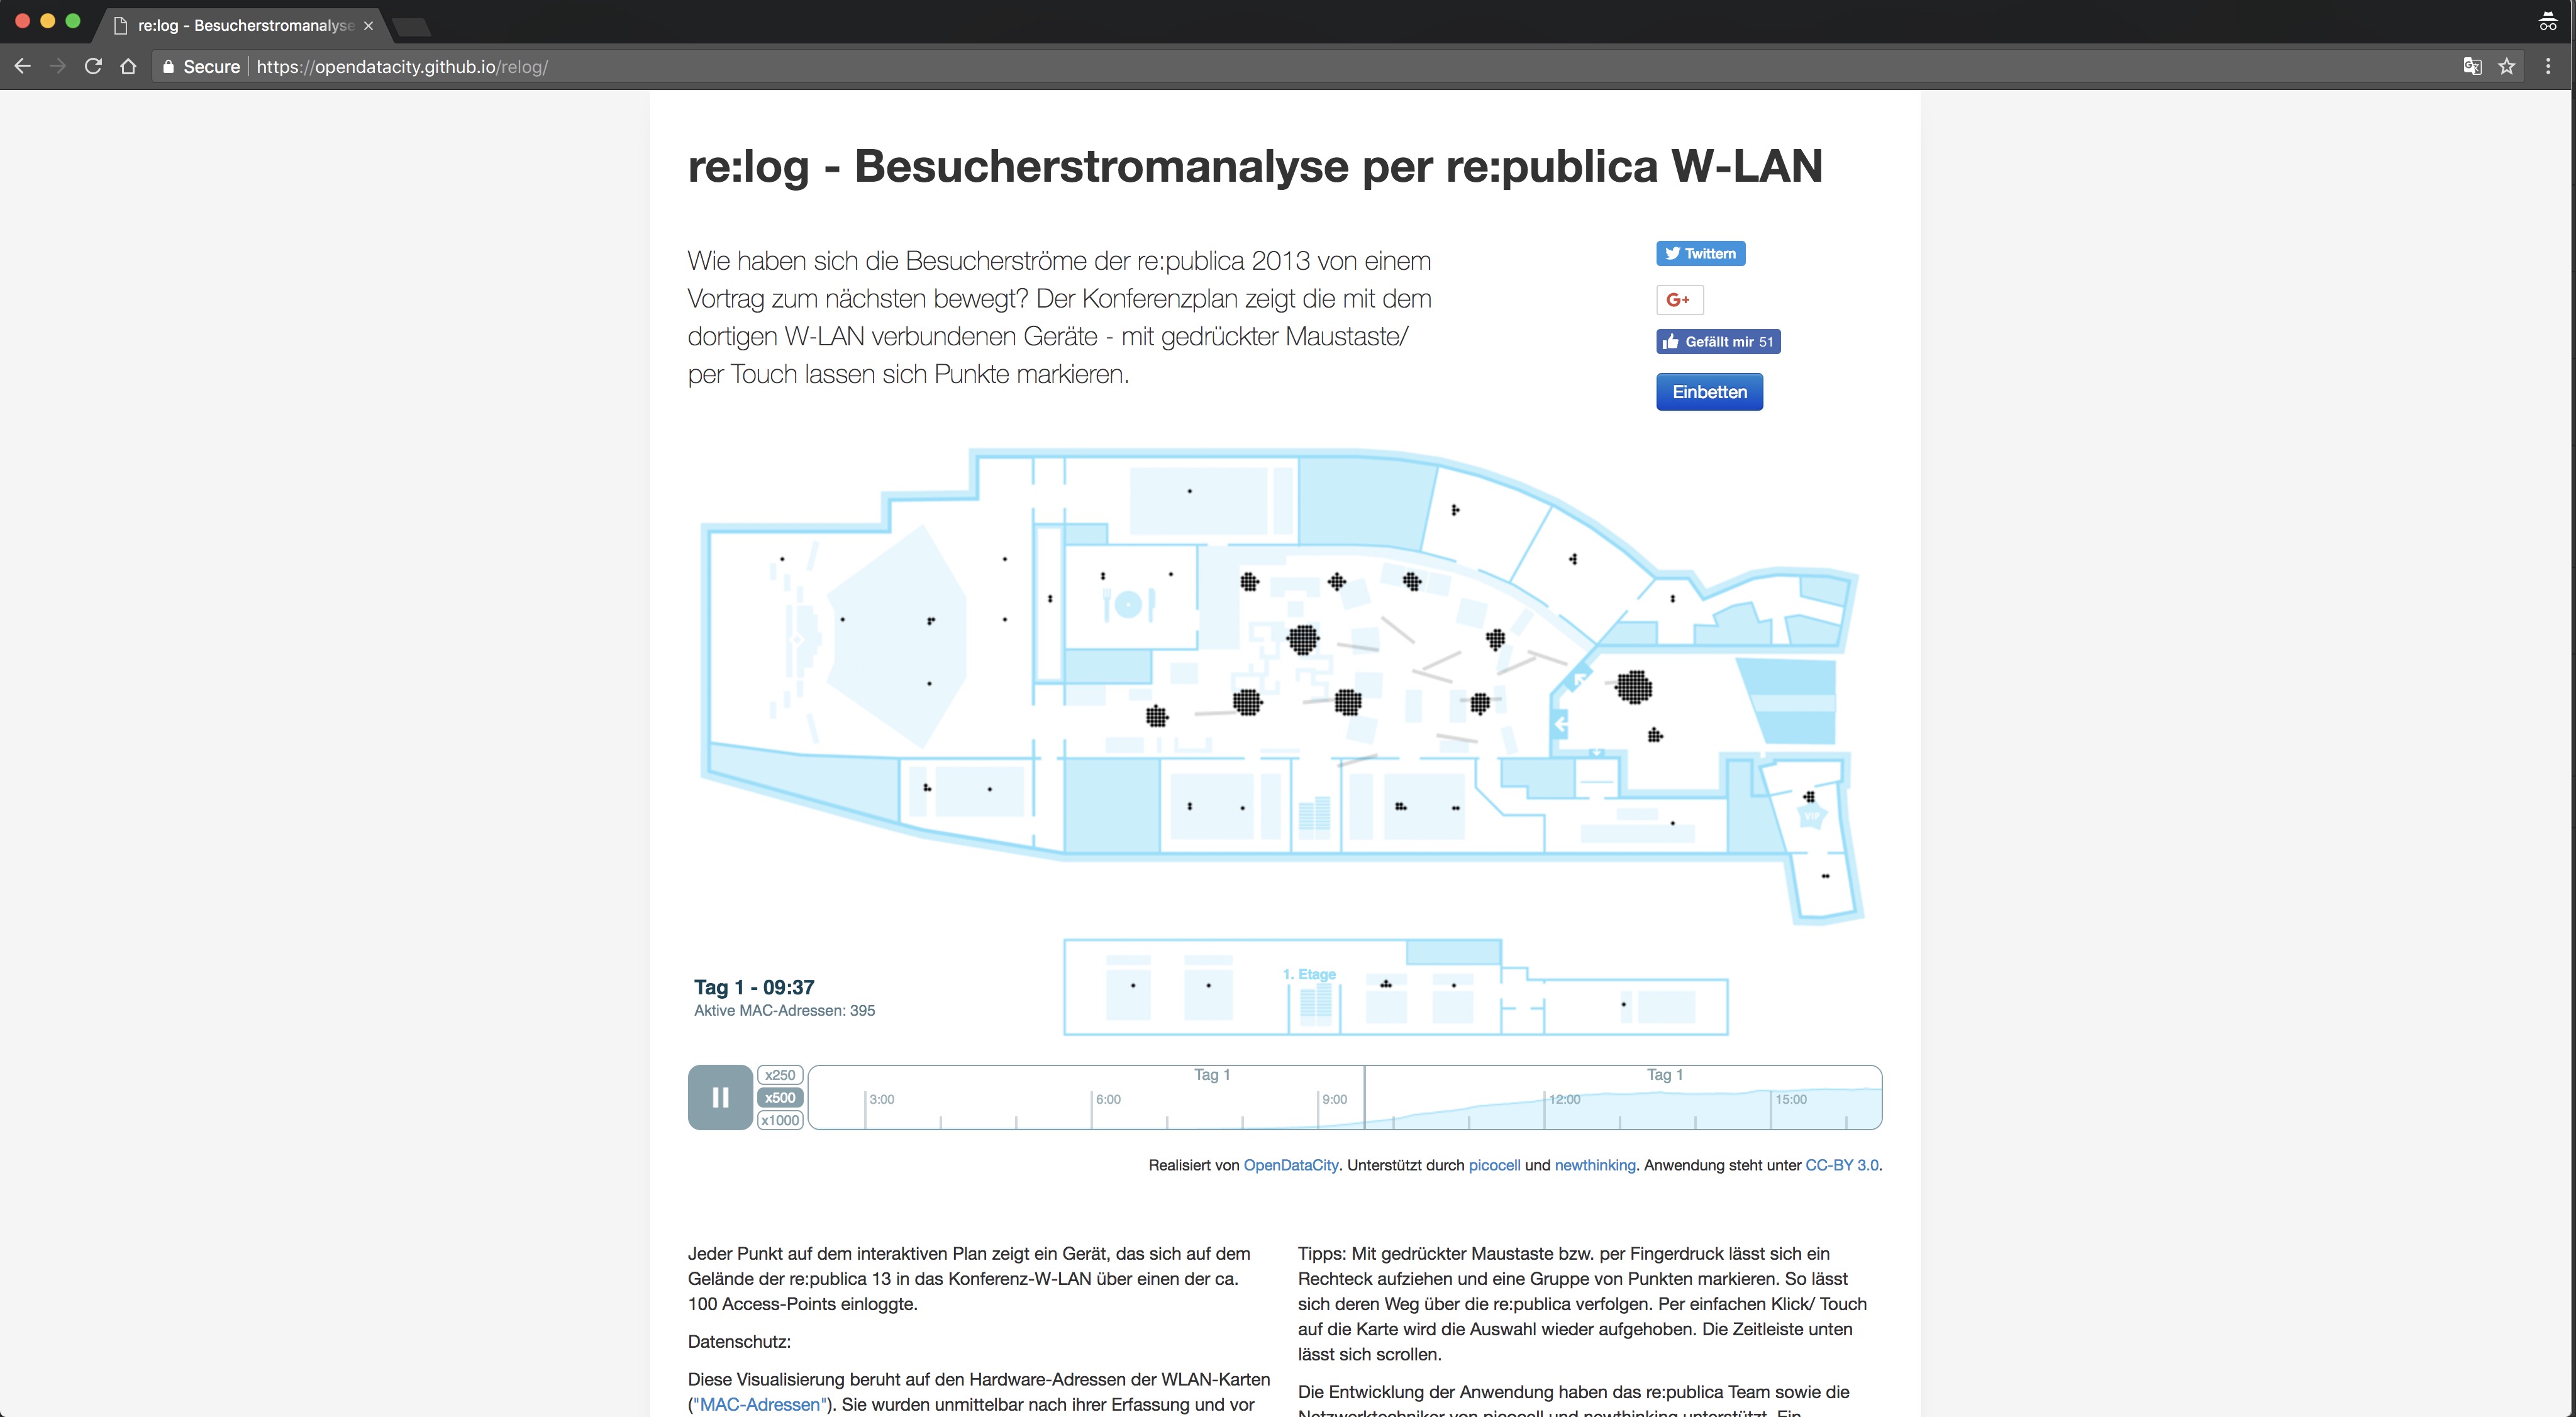
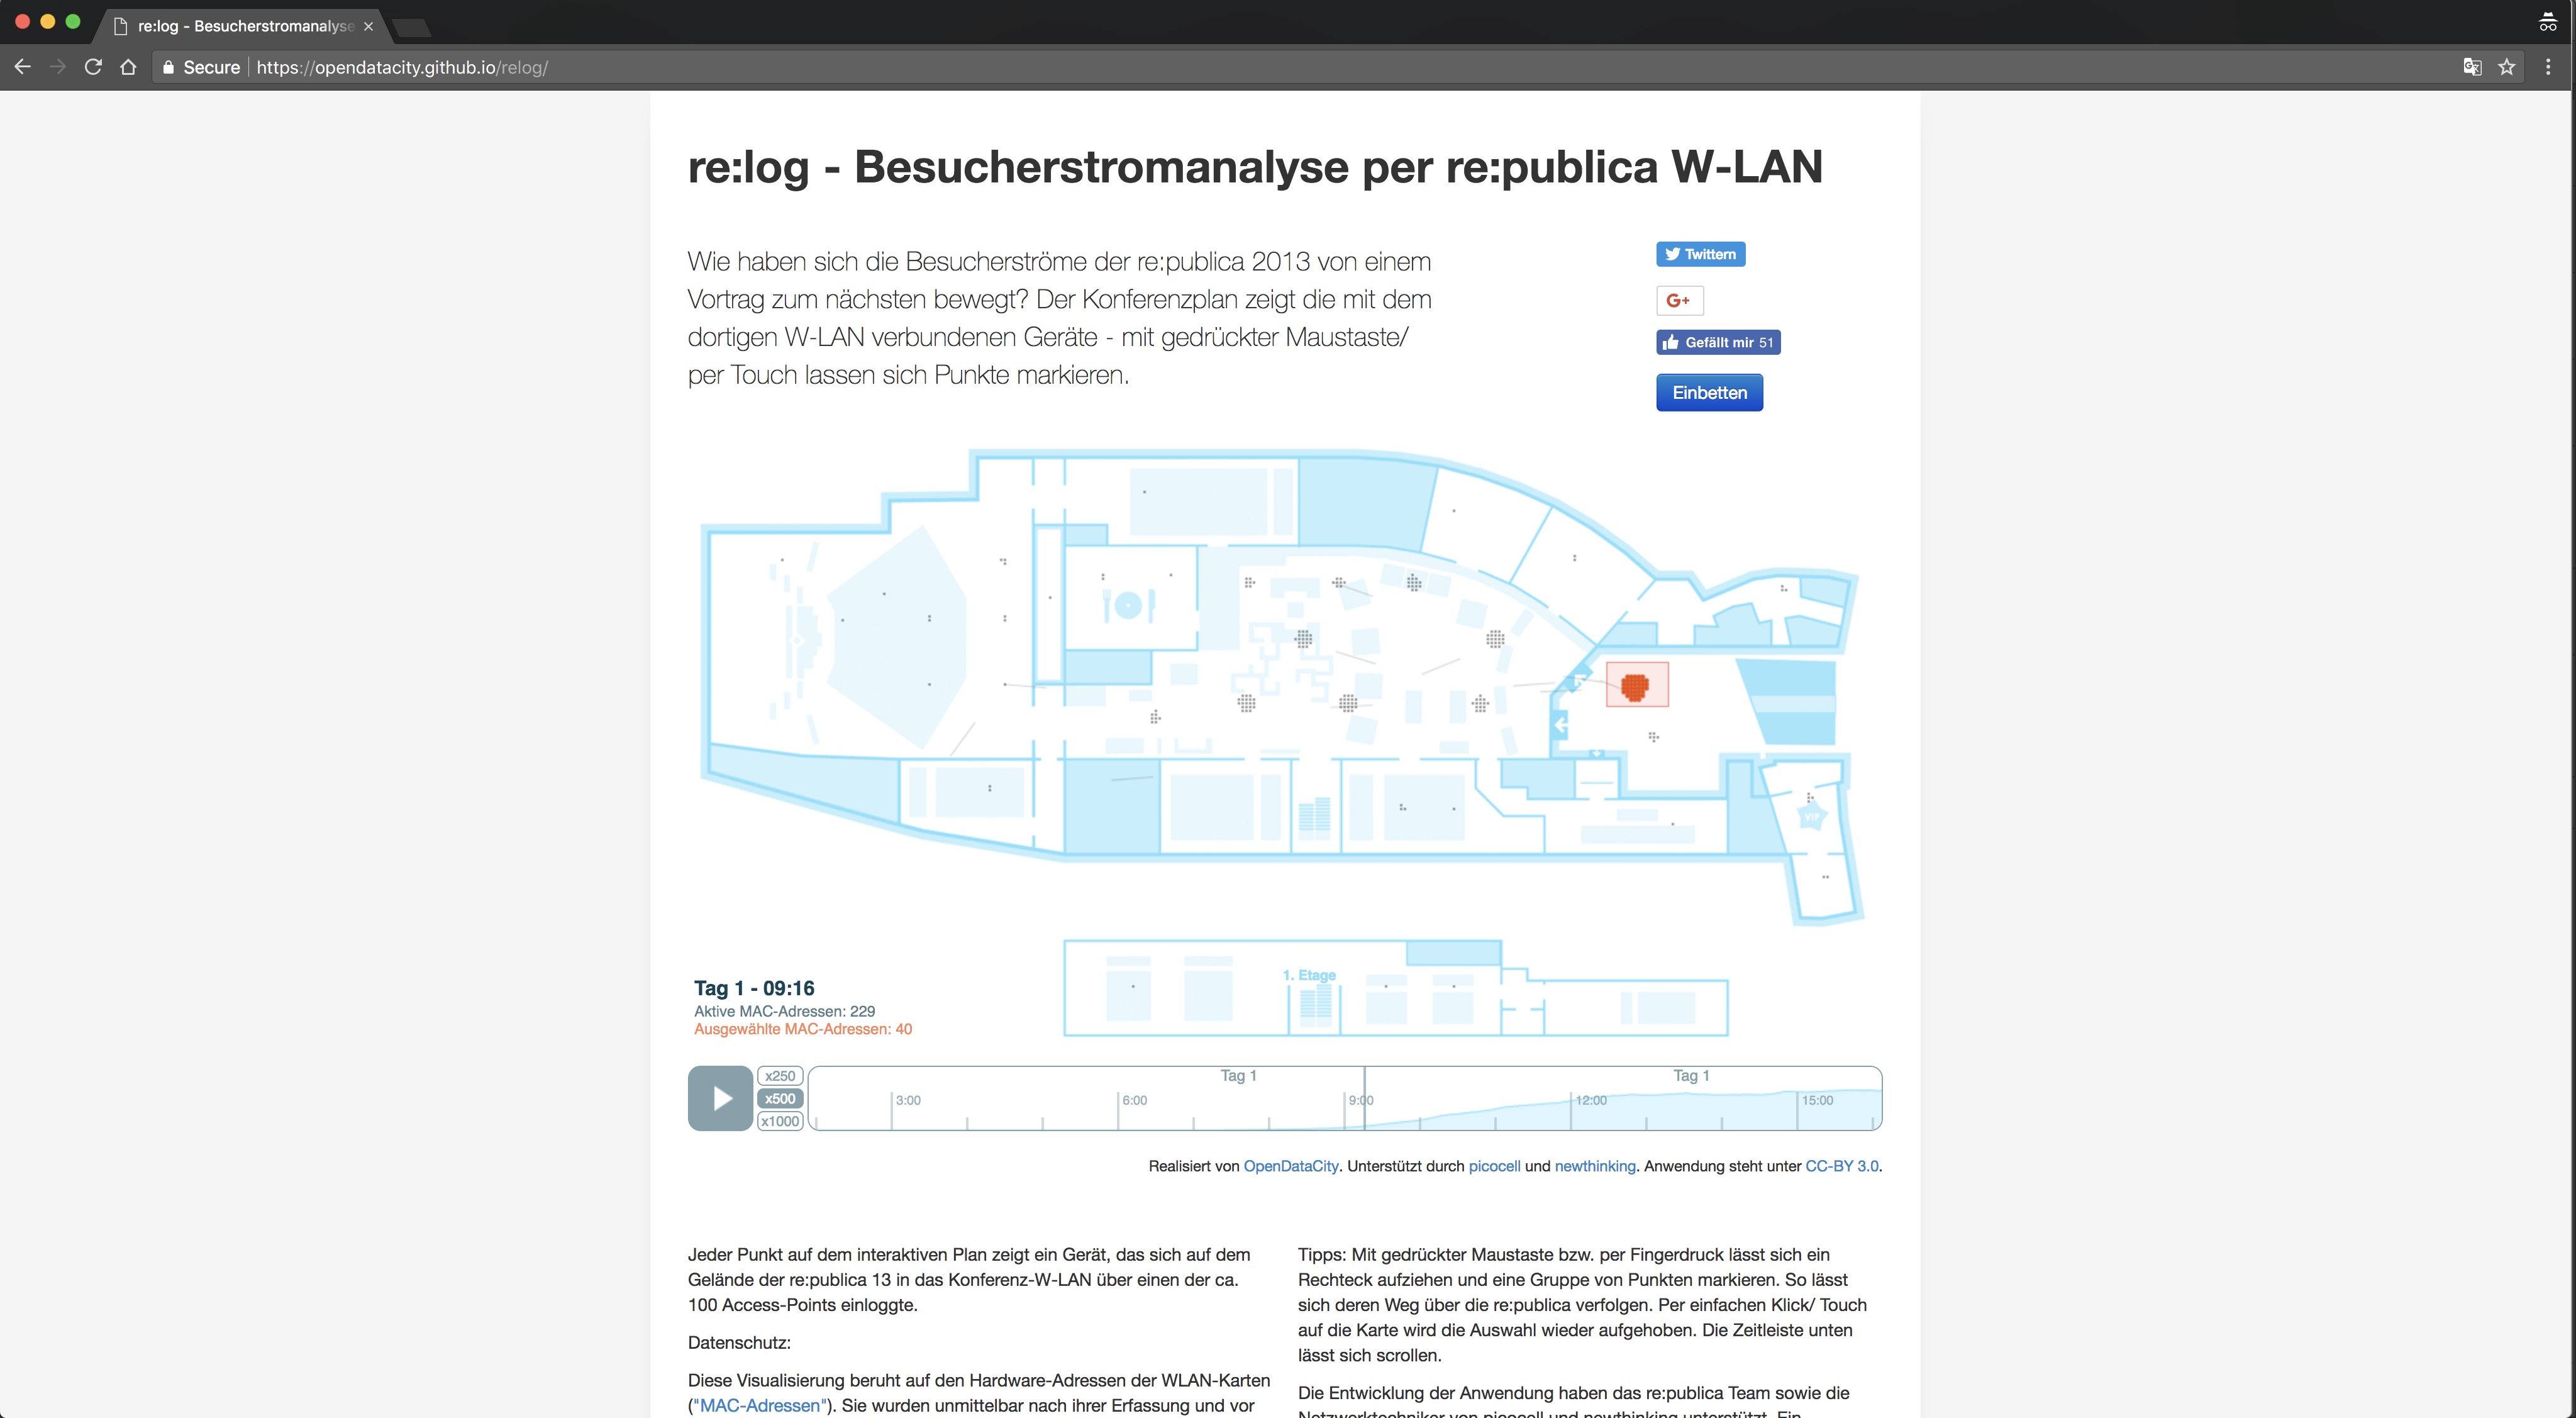
re:log - Besucherstromanalyse per re:publica W-LAN
https://opendatacity.github.io/relog/Created by:
OpenDataCityStart/end:
2013 - present
Status:
online
Type:
Investigative
Topic:
Surveillance
Subtopic:
in Massive events
This project showcase on an interactive map the devices (represented by dots) logged in on the building where re:publica 13 conference was held. This is a project that highlights protection of data. The visualisation answers how did the flow of visitors to re: publica 2013 move from one lecture to the next? It was possible to follow the position of the connected devices using the hardware addresses of the WLAN cards ( “MAC addresses” ). They were cryptographically pseudonymised by the re: publica network team immediately after their collection and prior to their disclosure to OpenDataCity, so that a conclusion on the addresses used is not possible (“salted and hashed”). Even if the devices are anonymised, the interface allows to select groups of dots and followed through time.